
CAGR isn't the actual return in reality. It's an imaginary number that describes the rate at which an investment would have grown if it grew at a steady rate. You can think of CAGR as a way to smooth out the returns.
Open Microsoft Excel. Either click on the green X icon on the dock or opening it from the Applications folder in Microsoft Office.

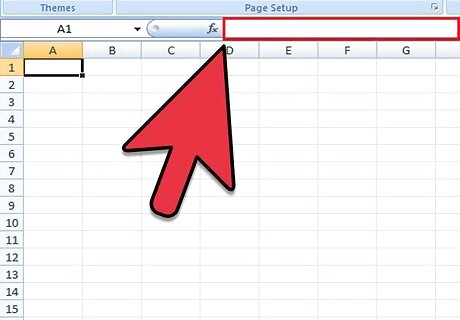
Open a New Workbook.
Enter the Headings/Defined Variables: Enter to cell A1 the label, CAGR Enter to cell B1 the label, Ending_Value Enter to cell C1 the label, Beginning_Value Enter to cell D1 the label, _1_OverYears Enter to cell E1 the label, Years Enter to cell F1 the label, _1
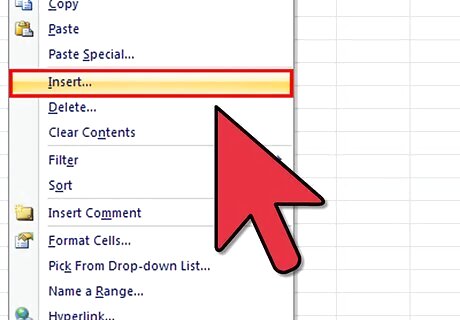
Highlight columns B:F and select Insert from the top menu. Click Names > Create and choose Top Row
Enter the formulas and values: Enter to cell A2 an = and then the formula ((Ending_Value/Beginning_Value)^(_1_OverYears))-_1 Enter to cell B2 the Ending Value of the investment, e.g. 23,512 Enter to cell C2 the Beginning Value of the investment, e.g. 14,500 Enter to cell E3 the number of Years the investment was outstanding up to the Ending Value, e.g. 3 Enter to cell D3 an = and then the formula, 1/Years. Enter to cell F3 the value, 1
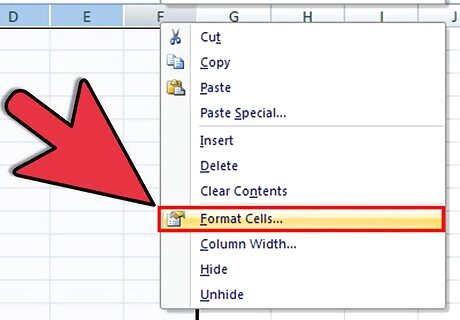
Format your cells: Highlight columns A:F and select Format from the top menu. Click Column and then AutoFit Selection, and Alignment Center. Highlight column A and choose Format, then Cells. Under the Number menu, and Percentage category, choose 2 decimal places. Highlight columns B:C and choose Format, then Cells. Under the number Number in the Custom category, enter $#,##0 Highlight column D and choose Format, then Cells. Under the Number menu in the Number category, enter .0000

Review the value in cell A2. For the example numbers given, you should see a CAGR result of 24.93% Thus, your CAGR for your three-year investment is equal to 24.93%, representing the smoothed annualized gain you earned over your investment time horizon.
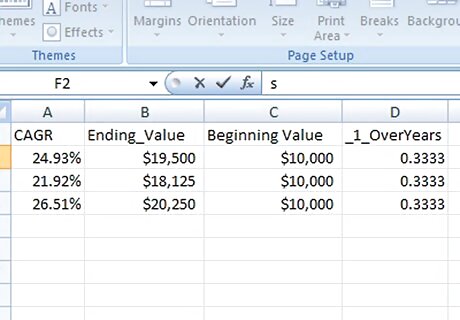
Then you would construct a Table of similar investments:


Comments
0 comment