views
- There are four functions for calculating standard deviation.
- STDEV.P and STDEV.S cover most situations. Use STDEV.P for populations and STDEV.S for samples.
- The function will calculate the standard deviation for a selected range of cells.
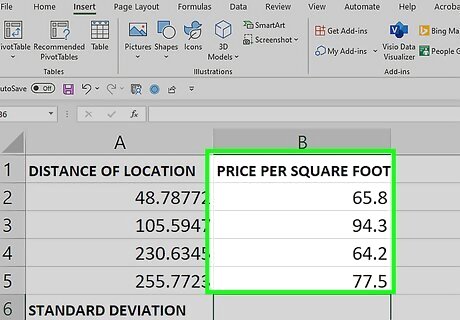
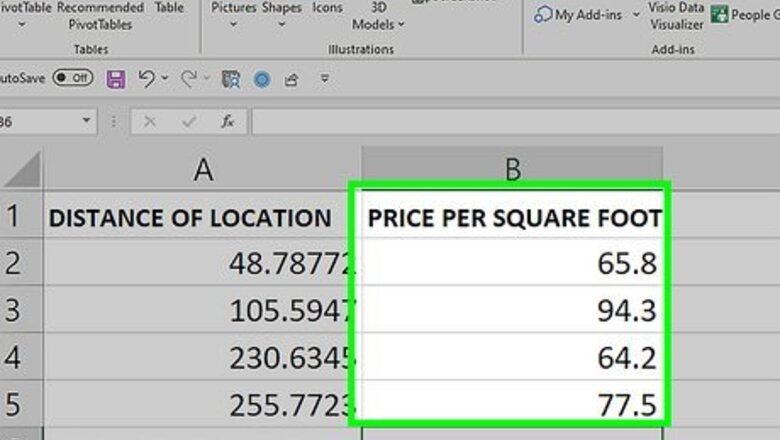
Enter the values you want to use. Pick a column in which you want to enter your data, then type each data value into individual cells in that column. Using Excel is a great way to organize and analyze your data. For example, if you select column "A" as the area in which to enter your data, you might type a number into cell A1, cell A2, cell A3, and so on. If needed, you can move columns in your spreadsheet to organize your data.
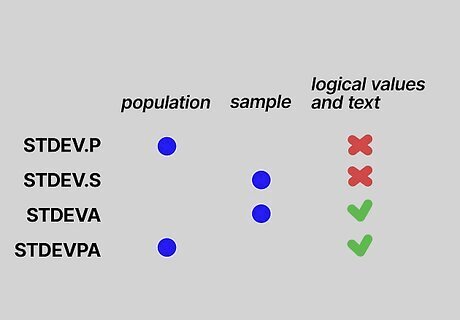
Note this information about the different functions. There are four functions in Excel for calculating standard deviation. The functions differ in two ways: The selected function will either calculate the standard deviation for a sample (using n - 1) or a population (using n), where n is the sample size. The selected function will include or exclude logical values (TRUE and FALSE) and text (numbers represented as text). TRUE is interpreted as a 1, while FALSE is 0.
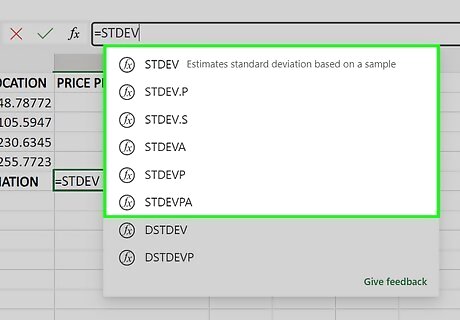
Choose a standard deviation function. Here are the four options for calculating standard deviation: STDEV.P — Finds the standard deviation of a population. This function doesn’t include logical values or text. STDEV.S — Finds the standard deviation of a sample. This function doesn’t include logical values or text. STDEVA — Finds the standard deviation of a sample. This function does include logical values or text. STDEVPA — Finds the standard deviation of a population. This function does include logical values or text. There are also two outdated functions that have been replaced by the above functions. They are still present in Excel for backward compatibility reasons, but may be phased out in future versions. STDEV — This function was replaced by STDEV.S. Finds the standard deviation of a sample. This function doesn’t include logical values or text. STDEVP — This function was replaced by STDEV.P. Finds the standard deviation of a population. This function doesn’t include logical values or text.
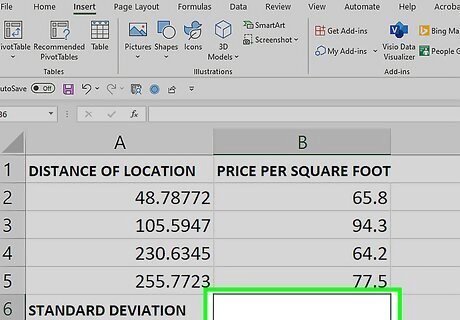
Click a blank cell. This should be the cell in which you want to display the standard deviation value. Doing so selects the cell.
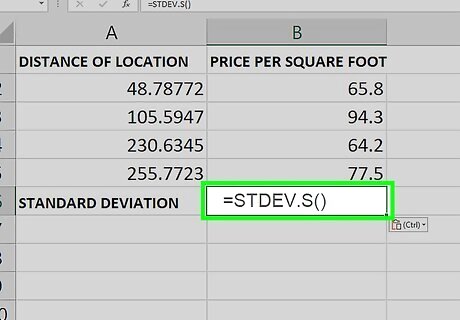
Type in the standard deviation function. In the cell you selected, enter the standard deviation function you want to use. Here is STDEV.S() as an example: =STDEV.S()
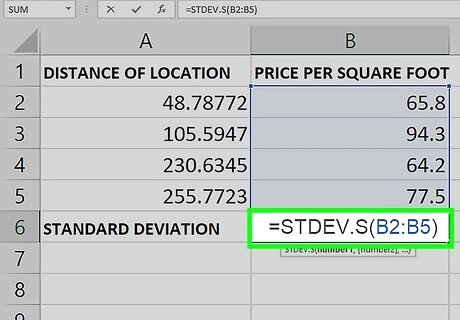
Add your value range. To do so: In between the parentheses, type the letter and number of the cell containing your first data value. Type a colon (:) Type the letter and number of the last cell. For example, if you entered your data in column "A" from rows 1 through 10, you would have =STDEV.S(A1:A10) typed here. If you just want to display the standard deviation of the value of a few scattered cells such as A1, B3, and C5, you can type the cell names separated by commas (e.g., =STDEV.S(A1,B3,C5)).
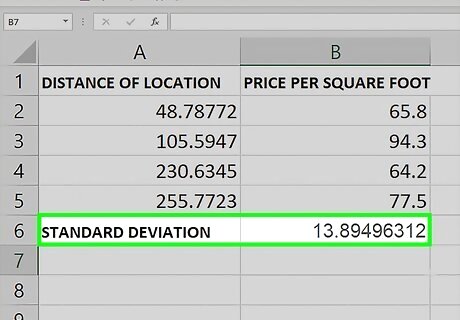
Press ↵ Enter. This will prompt Excel to run the formula, displaying the standard deviation of the selected cells in the formula's cell. If you want to check your work, you can calculate the standard deviation by hand.


Comments
0 comment